
")
")


Pepijn van Oort
Publications on Geodesy 60, Delft, 2005. 140 pagina's.
ISBN-13: 978 90 6132 295 5. ISBN-10: 90 6132 295 2.
Summary
The growing availability of spatial data along with growing ease to use the spatial data (thanks to wide-scale adoption of GIS) have made it possible to use spatial data in applications inappropriate considering the quality of the data. As a result, concerns about spatial data quality have increased. To deal with these concerns, it is necessary to (1) formalise and standardise descriptions of spatial data quality and (2) to apply these descriptions in assessing the suitability (fitness for use) of spatial data, before using the data. The aim of this thesis was twofold: (1) to enhance the description of spatial data quality and (2) to improve our understanding of the implications of spatial data quality.
Chapter 1 sets the scene with a discussion on uncertainty and an explanation of why concerns about spatial data quality exist. Knowledge gaps are identified and the chapter concludes with six research questions.
Chapter 2 presents an overview of definitions of spatial data quality. Overall, I found a strong agreement on which elements together define spatial data quality. Definitions appear to differ in two aspects: (1) the location within the meta-data report: some elements occur not in the spatial data quality section but in another section of the meta-data report; and (2) the explicitness with which elements are recognised as individual elements. For example, the European pre-standard explicitly recognises the element ‘homogeneity’. Other standards recognise the importance of documenting the variation in quality, without naming it explicitly as an individual element.
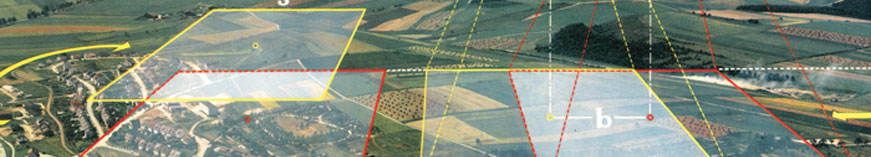
In chapter 3 we quantified the spatial variability in classification accuracy for the agricultural crops in the Dutch national land cover database (LGN). Classification accuracy was significantly correlated with: (1) the crop present according to LGN, (2) the homogeneity of the 8-cell neighbourhood around each cell, (3) the size of the patch in which a cell is located, and (4) the heterogeneity of the landscape in which a cell is located.
In chapter 4 I present methods that use error matrices and change detection error matrices as input to make more accurate land cover change estimates. It was shown that temporal correlation in classification errors has a significant impact and must be taken into account. Producers of time series land cover data are recommended not only to report error matrices, but also change detection error matrices.
Chapter 5 focuses on positional accuracy and area estimates. From the positional accuracy of vertices delineating polygons, the variance and covariance in area can be derived. Earlier studies derived equations for the variance, this chapter presents a covariance equation. The variance and covariance equation were implemented in a model and applied in a case-study. The case-study consisted of 97 polygons with a small subsidy value (in euros per hectare) assigned to each polygon. With the model we could calculate the uncertainty in the total subsidy value (in euros) of the complete set of polygons as a consequence of uncertainty in the position of vertices.
Chapter 6 explores the relationship between completeness of spatial data and risk in digging activities around underground cables and pipelines. A model is presented for calculating the economic implications of over- and incompleteness. An important element of this model is the relationship between detection time and costs. The model can be used to calculate the optimal detection time, i.e. the time at which expected costs are at their minimum.
Chapter 7 addresses the question why risk analysis (RA) is so rarely applied to assess the suitability of spatial data prior to using the data. In theory, the use of RA is beneficial because it allows the user to judge if the use of certain spatial data does not produce unacceptable risks. Frequently proposed hypotheses explaining the scarce adoption of RA are all technical and educational. In chapter 7 we propose a new group of hypotheses, based on decision theory. We found that the willingness to spend
resources on RA depends (1) on the presence of feedback mechanisms in the decision-making process, (2) on how much is at stake and (3) to a minor extent on how well the decision-making process can be modelled.
Chapter 8 presents conclusions on the six research questions (chapters 2-7) and lists recommendations for users, producers and researchers of spatial data. With regard to the description, four recommendations are given. Firstly, spend more effort on documenting the lineage of reference data. Secondly, quantify and report correlation of quality between related data sets. Thirdly, investigate the integration of different forms of uncertainty (error, vagueness, ambiguity). Fourthly, study the implementation and use of spatial data quality standards. With regard to the application of spatial data quality descriptions, I have two main recommendations. Firstly, to continue the line of research followed in this thesis: quantification of implications of spatial data quality, through development of theory along with tangible illustrations in case-studies.
Secondly, there is a need for more empirical research into how users cope with spatial data quality.
Contents
- Introduction.
- Spatial data quality: terms and definitions
- Spatial variability in classification accuracy
- Land cover change and classification errors
- A variance and covariance equation for area estimates
- Detection and risk in digging activities
- Do users ignore spatial data quality?
- Conclusions and recommendations
References
Abstract
Samenvatting
Curriculum vitae
List of publications
Samenvatting
Sinds de jaren 1960 is de hoeveelheid beschikbare geo-informatie sterk toegenomen; met Geografische Informatie Systemen (GIS) kan deze geo-informatie gebruikt worden in een veelheid aan toepassingen, ook in toepassingen waarvoor de kwaliteit van de informatie eigenlijk onvoldoende is. Om tegemoet te komen aan zorgen over kwaliteit van geo-informatie zijn nodig: (1) de beschrijving van kwaliteit van geo-informatie door middel van duidelijke en gestandaardiseerde definities en (2) de geschiktheid van de geo-informatie beoordelen voordat de geo-informatie wordt gebruikt in toepassingen. De doelen van dit proefschrift waren: (1) onderzoek naar de beschrijving van kwaliteit van geo-informatie (2) inzicht verkrijgen in de implicaties van kwaliteit van geo-informatie.
Hoofdstuk 1 beschrijft verschillende vormen van onzekerheid en verklaart de toegenomen interesse in de kwaliteit van geo-informatie. Het schetst de leemtes in de huidige kennis en eindigt met zes onderzoeksvragen.
Hoofdstuk 2 biedt een overzicht van diverse definities van het begrip kwaliteit van geo-informatie. Ik vond grote overeenstemming tussen de vergeleken definities. De definities bleken op twee onderdelen te verschillen. Ten eerste de locatie binnen de meta-data: niet alle elementen van kwaliteit worden noodzakelijkerwijs beschreven in de kwaliteit sectie van de meta-data. Ten tweede de mate waarin elementen met naam genoemd worden. Bijvoorbeeld het element ''homogeniteit'', ofwel variatie in de kwaliteit, wordt in de Europese voornorm expliciet genoemd. In andere standaarden wordt het belang van dit element wel onderkend, maar het wordt niet expliciet als een element genoemd.
Voor hoofdstuk 3 kwantificeerden wij voor de landbouwgewassen in het Landelijk Grondgebruiksbestand Nederland (LGN) de ruimtelijke variatie in classificatie nauwkeurigheid. De classificatie nauwkeurigheid bleek gecorreleerd met: (1) het volgens LGN aanwezige landbouwgewas, (2) de homogeniteit van de 8 grid cellen rondom iedere grid cel, (3) de grootte van het perceel waarin een grid cel ligt en (4) de heterogeniteit van het landschap waarin een grid cel ligt.
In hoofdstuk 4 worden methoden gepresenteerd om, gebruik makend van foutenmatrices, nauwkeurigere schattingen van veranderingen in landgebruik te maken. Het komt relatief vaak voor dat op twee tijdstippen dezelfde misclassificatie optreedt. Het is belangrijk om daar rekening mee te houden en hoofdstuk 4 presenteert ook de daarvoor geschikte methoden.
Hoofdstuk 5 gaat over positionele nauwkeurigheid en oppervlakte schattingen. Vertices beschrijven de omtrek van polygonen. Met behulp van foutenvoortplanting kunnen vergelijkingen voor de variantie en covariantie van oppervlakte schattingen worden afgeleid, als functie van onzekerheid in de coördinaten van de vertices. Eerdere studies presenteerden variantie vergelijkingen, dit hoofdstuk presenteert voor het eerst ook een covariantie vergelijking. Beide vergelijkingen zijn ingevoerd in een model en toegepast in een casestudie. De case-studie bestond uit 97 polygonen met ieder een kleine subsidie (in euros per hectare). Met behulp van het model konden wij de onzekerheid in het totale subsidie bedrag (in euros) berekenen.
Hoofdstuk 6 legt het verband tussen de volledigheid van geo-informatie en de graafschade risico’s bij graafwerkzaamheden nabij ondergrondse kabels en leidingen. In het hoofdstuk presenteren wij een model waarmee de financiële implicaties van over- en incompleetheid berekend kunnen worden. Belangrijk onderdeel van dit model is de relatie tussen detectie tijd en kosten. Met het model kan de optimale detectie tijd (de tijd waarbij de verwachte kosten het laagst zijn) berekend worden.
Hoofdstuk 7 gaat in op de vraag waarom zo zelden foutenvoortplanting en risicoanalyse (RA) worden gebruikt vooraf aan het gebruik van geo-informatie. Theorie suggereert dat RA verstandig zou zijn omdat het de gebruiker in staat stelt om te beoordelen of gebruik van bepaalde geo-informatie leidt tot onaanvaardbare risico's. De meeste hypotheses voor het schaarse gebruik van RA zijn van technische aard of gerelateerd aan kennis van de gebruiker. In hoofdstuk 7 zijn hypotheses op het bestuurlijke vlak geformuleerd en getoetst. Daaruit bleek dat de bereidheid om geld en tijd te spenderen aan RA afhangt van (1) terugkoppelingsmechanismen in het besluitvormingsproces; (2) hoeveel er op het spel staat en (3) in mindere mate van hoe goed de beslissing in een model te beschrijven is.
Hoofdstuk 8 geeft antwoorden op de zes onderzoeksvragen (hoofdstukken 2-7) en doet aanbevelingen voor gebruikers, producenten en onderzoekers van geo-informatie. Ten aanzien van de beschrijving van kwaliteit worden vier aanbevelingen gedaan: (1) meer aandacht voor de beschrijving van hoe referentie data werden verkregen (2) onderzoek naar de correlatie tussen fouten in verschillende data sets, (3) onderzoek naar methoden om meerdere vormen van onzekerheid (error, vagueness, ambiguity) in een model op te nemen en (4) onderzoek naar de implementatie van standaarden. Ten aanzien van het gebruik van kwaliteits- beschrijvingen voor het bepalen van geschiktheid voor gebruik heb ik twee aanbevelingen. Ten eerste, doorgaan op de in dit proefschrift ingeslagen weg: het kwantificeren van implicaties van kwaliteit van geo-informatie, door ontwikkeling van theorie en parallel daaraan aansprekende toepassing van de theorie in case-studies. Mijn tweede aanbeveling is om meer empirisch onderzoek te doen naar hoe gebruikers omgaan met kwaliteit van geo-informatie.